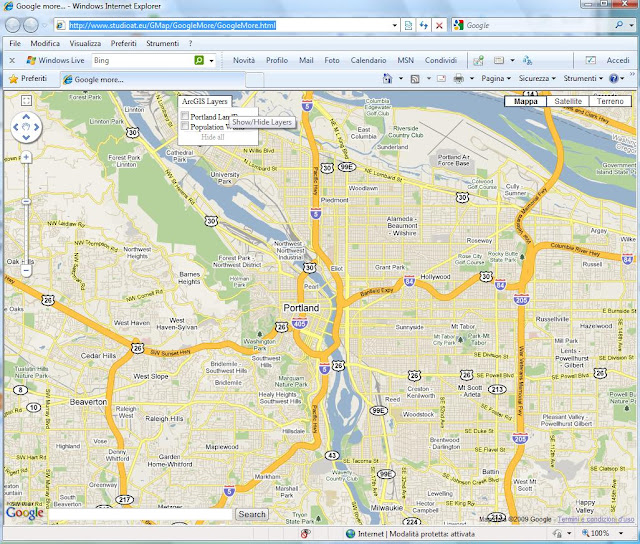
Looking at the beginning of the file more.js in folder js, you can set the layers you want to add in the menu and you also can set other settings.
In a nutshell, to add a tile layer you have to put in layersDefinition variable an instruction such as the following:
{'type':'Tiled',
'service':'http://sampleserver1.arcgisonline.com/ArcGIS/rest/services/Portland/ESRI_LandBase_WebMercator/MapServer',
'visible':true,
'caption':'Portland LandBase',
'options':{ opacity: 0.65, minResolution: 0, maxResolution: 19 }}
service: ArcGIS Server REST resource identified url
visible: the initial visibility
caption: the caption name in the menu
options: the layer options
Instead, in order to add a dynamic layer, put a line such as the following:
{'type':'Dynamic',
'service':'http://sampleserver1.arcgisonline.com/ArcGIS/rest/services/Demographics/ESRI_Population_World/MapServer',
'visible':false,
'caption':'Population World',
'parameter':null,'opacity':0.75}
service: ArcGIS Server REST resource identified url
visible: the initial visibility
caption: the caption name in the menu
parameter: the layer parameter
opacity: the layer opacity
In this case, two layers were added (Portland Land and Population World).
To enrich the page with some more functionalities, they were drawn from Google Maps API Demo Gallery:
- Tabbed Max InfoWindow + Dynamic Content ( you can see it by clicking on a building in the town of Portland )
In the code it is easy to customize the visualization of your data following what has been done for the layer building.
-KeyDragZoom (shift + drag )


Nessun commento:
Posta un commento